C3.ai Valuation Analysis: A DCF Perspective
C3.ai (NYSE: AI) is a key player in enterprise AI, but its financials present a mixed picture. Using a Discounted Cash Flow (DCF) approach, we examine the key drivers of its valuation and potential risks.
Revenue Growth and Margins
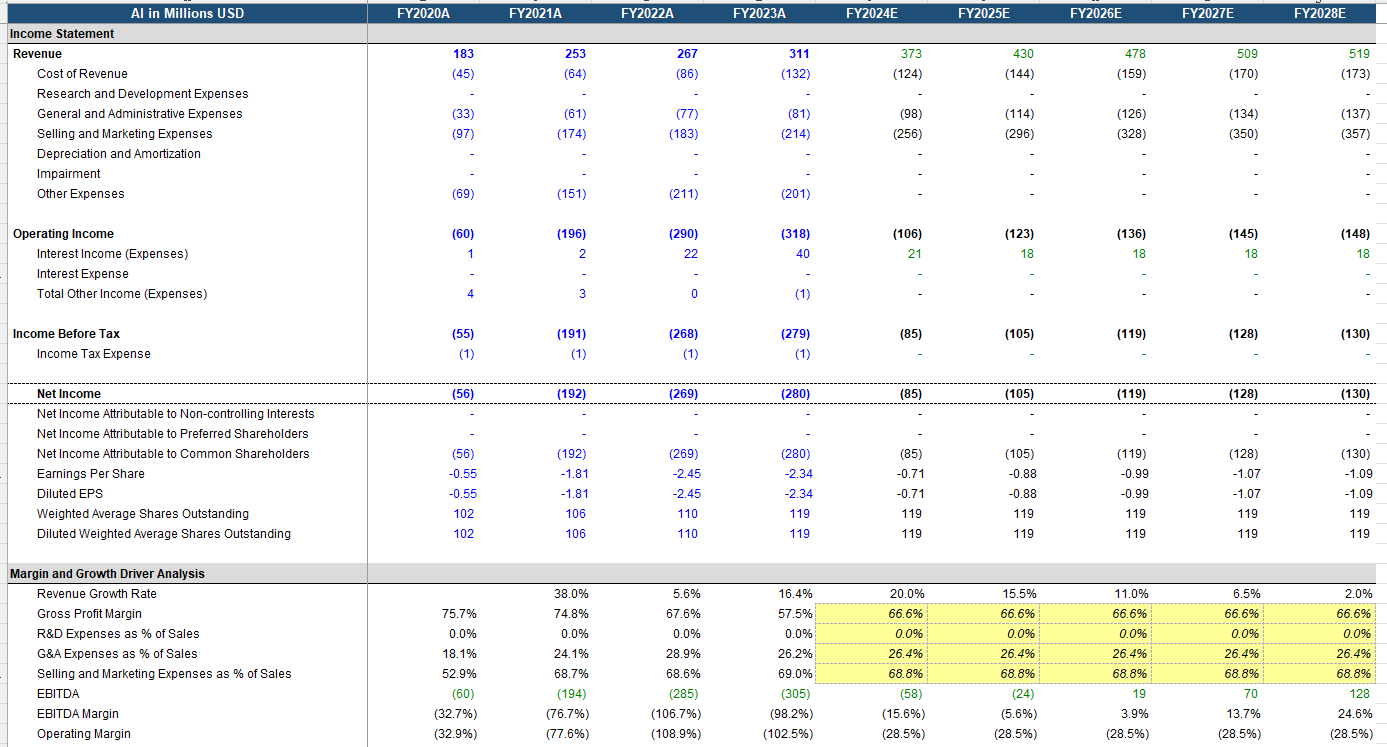
C3.ai’s revenue has grown steadily, from 183M USD in FY2020 to 311M USD in FY2023, with a forecast of $373M in FY2024 (+20% YoY). However, annual growth is expected to slow to 2% by FY2028, indicating challenges in sustaining momentum.
The company boasts high gross margins (66%-75%), reflecting strong pricing power and scalability. These margins are a key strength, but high operating expenses (~94% of revenue in FY2024) remain a major drag on profitability.

*C3.ai’s income statement, generated by FiMo Copilot, in merely seconds. *
👉 Click here to start generating the same professional financial model.
✅ Fully reconciled financials
✅ Smart WACC calculation
✅ AI-powered peer analysis
✅ Historical + forecast data
✅ All formulae linked and transparent
Profitability and Cash Flow
C3.ai has yet to achieve profitability, with a forecasted net loss of 85M USD in FY2024. Operating expenses, particularly selling and marketing (~68% of revenue), weigh heavily on the bottom line.
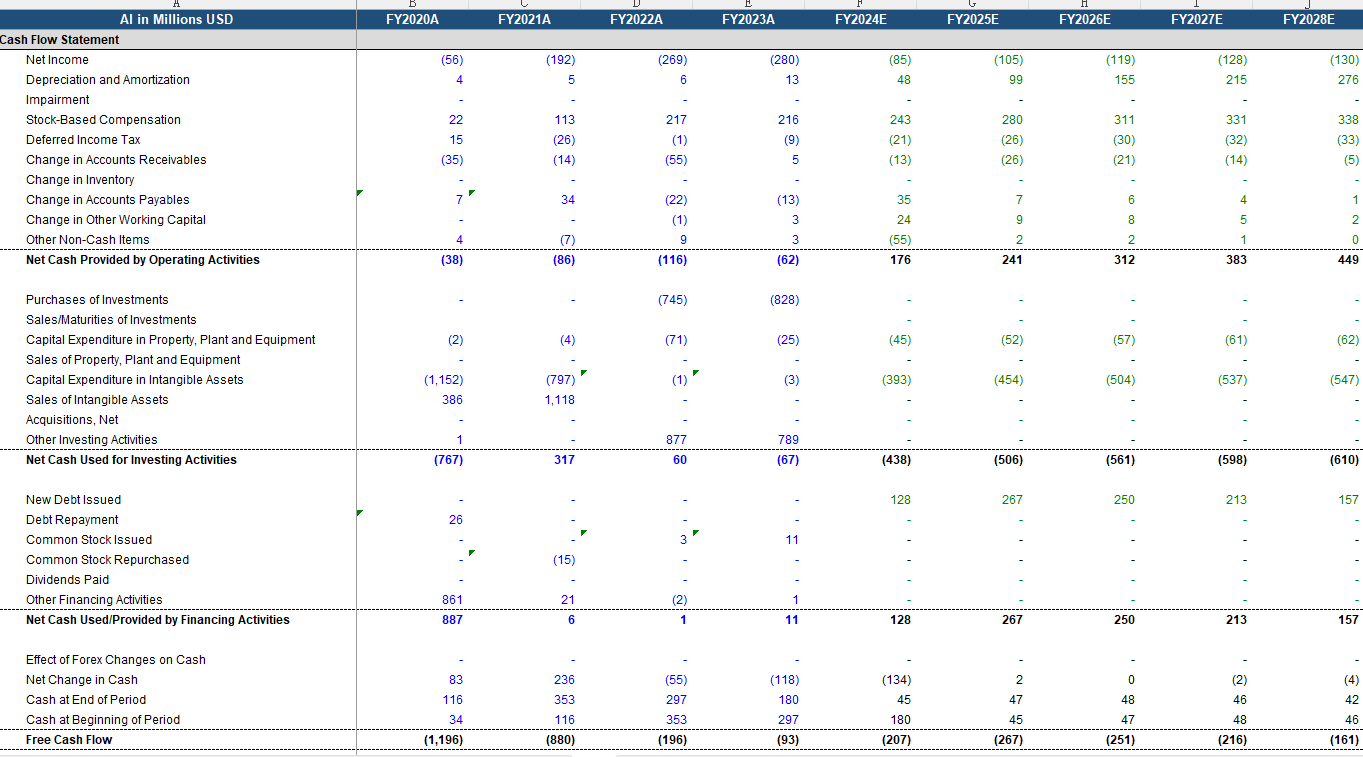
On the brighter side, operating cash flow is turning positive (176M USD forecasted for FY2024) and is projected to grow consistently through FY2028. However, free cash flow remains negative (-207M USD in FY2024) due to significant investments, delaying true financial sustainability.

C3.ai’s cash flow statement, generated by FiMo Copilot, in merely seconds.
👉 Click here to start generating the same professional financial model.
✅ Fully reconciled financials
✅ Smart WACC calculation
✅ AI-powered peer analysis
✅ Historical + forecast data
✅ All formulae linked and transparent
Balance Sheet Strength
C3.ai’s balance sheet is a key strength, with $783M in current assets and no debt as of FY2024. This provides ample liquidity to fund operations and growth initiatives.
However, intangible assets are projected to make up ~55% of total assets by FY2028, posing valuation risks if growth expectations are not met.
DCF Valuation Insights
A DCF analysis emphasizes cash flow as the foundation of C3.ai’s intrinsic value. Positive operating cash flow trends are encouraging, but the company’s path to free cash flow positivity and profitability is critical. Slowing revenue growth and high expenses suggest limited short-term upside unless cost controls improve.
Key DCF Drivers
- Revenue Growth: Decelerating growth limits long-term upside.
- Margins: High gross margins support scalability, but operating costs must decline.
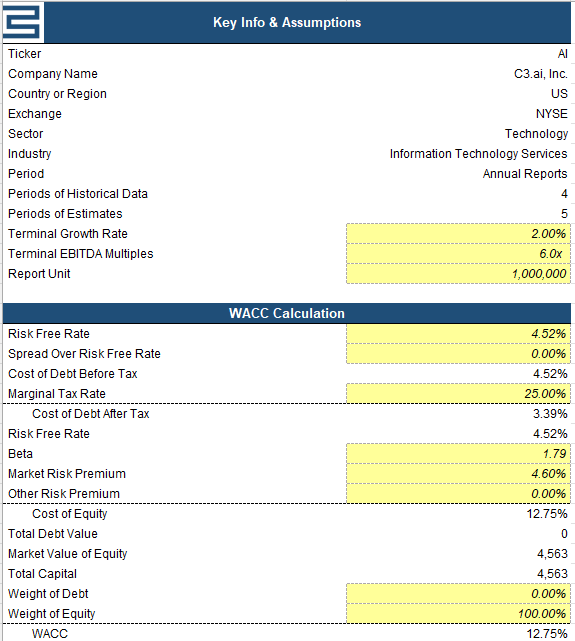
- Discount Rate: A 12%-14% discount rate reflects the company’s high-risk profile.

C3.ai’s discount rate chart, generated by FiMo Copilot, in merely seconds.
👉 Click here to start generating the same professional financial model.
✅ Fully reconciled financials
✅ Smart WACC calculation
✅ AI-powered peer analysis
✅ Historical + forecast data
✅ All formulae linked and transparent
Key Risks and Opportunities
Bull Case:
- Strong gross margins and a robust cash position provide stability and flexibility.
- Growth in the enterprise AI market offers long-term potential.
Bear Case:
- Persistent losses and high expenses hinder profitability.
- Slowing revenue growth and reliance on intangibles pose valuation risks.
- Stock-based compensation dilutes shareholder value.
Conclusion
C3.ai’s valuation depends on its ability to control costs and achieve sustainable free cash flow. While the company’s strong cash position and improving cash flow trends are promising, slowing growth and persistent losses warrant caution. From a DCF perspective, long-term value hinges on profitability and operational efficiency.
Disclaimer: This analysis is for informational purposes only. Consult a financial advisor before investing.